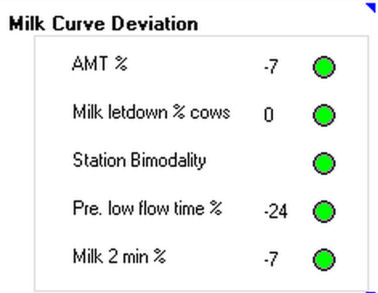
Milk Curve Deviation Indicators
The following Milk Curve Deviation indicators are displayed on the dashboard. Click the title or blue triangle to open the detailed Milk Curve Report and Graph:

|
Indicator |
Description |
|---|---|
|
AMT % |
Actual Milking Time (AMT) refers to the length of time from cluster attachment to cluster removal. The AMT indicator provides alerts to significant increases to the AMT, compared to the average AMT for the session. A red alert indicates a high number of cows experienced excessive/prolonged milking time. This can be related to cow restlessness during the milking. |
|
Milk letdown % cows |
Displays the percentage of animals with milk holdup. This may be an indication of preparation problems (they were not prepared for start of the milking in the desired way). |
|
Bimodality |
Bimodality refers to the two streams of milk. The first milk stream extracted from the cow is stored in her udder cistern. The second stream comes from her alveoli, and is the main milk volume. Optimal milking is indicated by a single, steady and continuous milk flow from the first stream (cistern) to the second stream (alveoli). Bimodality is detected when the two streams are obtained in separate phases. A red alert indicates the presence of bimodality, which is caused by a failure to properly stimulate the cows prior to milking, to encourage good milk let-down. |
|
Pre. low flow time % |
The time of low milk flow at the first phase of milking (see Milk Curve Report and Graph) is another indication for poor udder preparation for milking. Red alert is an indication that cows are delaying milk let down. |
|
Milk 2 min % |
Percentage of milk harvested in the first 2 minutes of milking. This is another indication for ease and speed of milk letdown. A green light indicates the cows were adequately stimulated for easy-flowing milk let-down. |